屏幕快照
介绍
Sound You Can See !
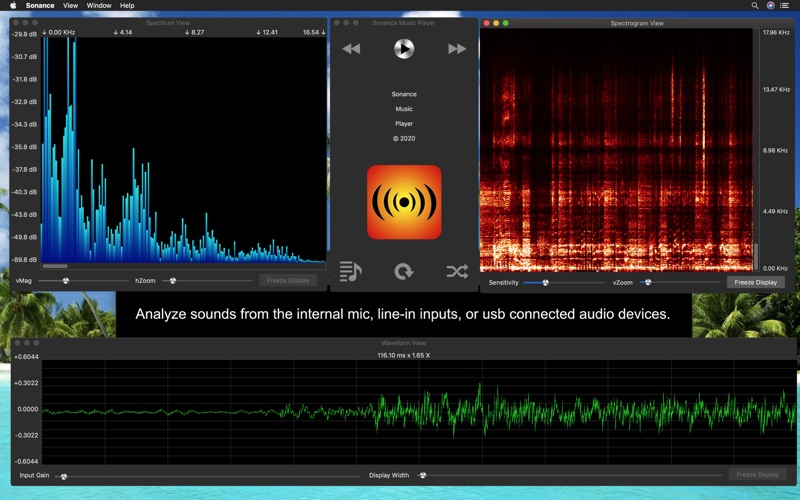
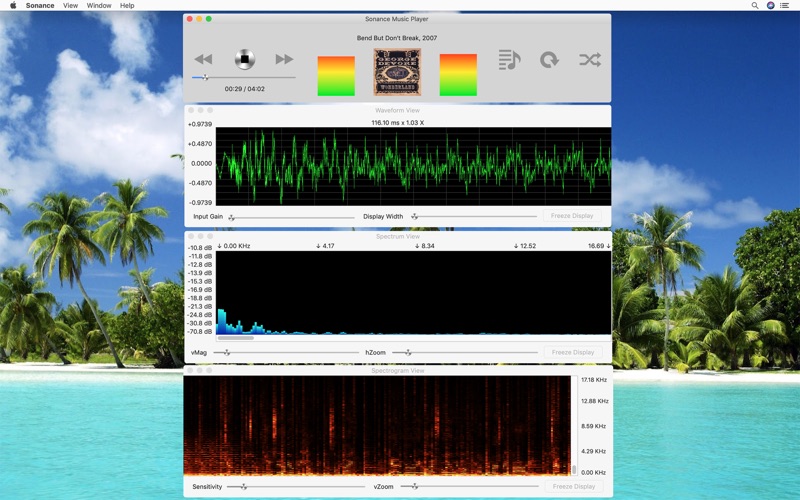
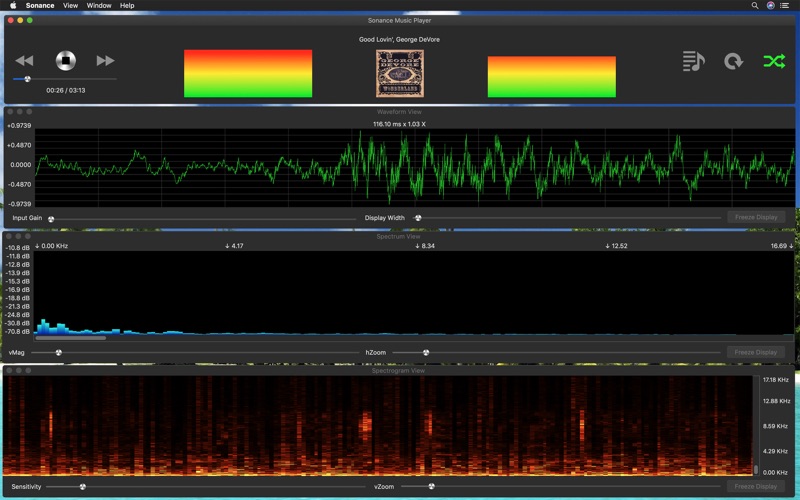
Sonance is an Audio Spectrum Analyzer & Spectrograph App, and a Music Player. It analyzes sound from songs played by the music player or from the built in microphone, or from the Line in input device, and displays the results in three separate views.
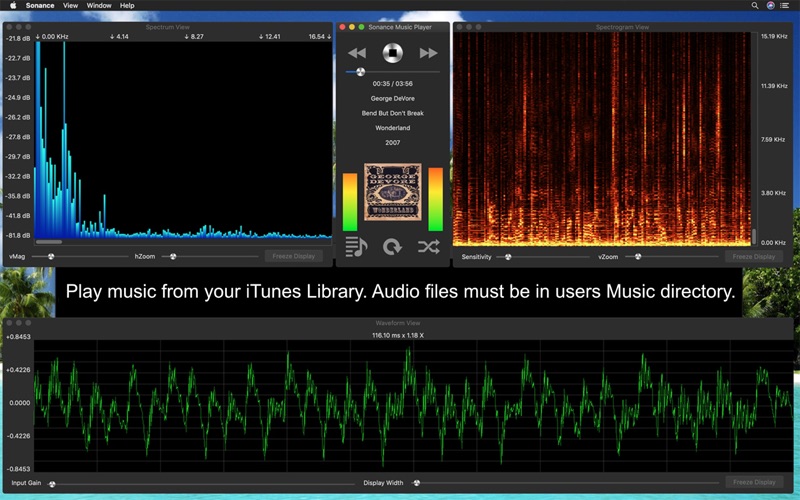
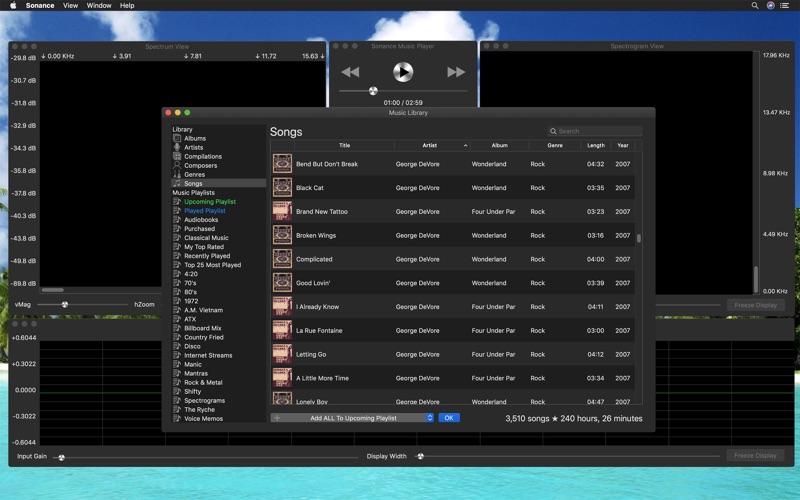
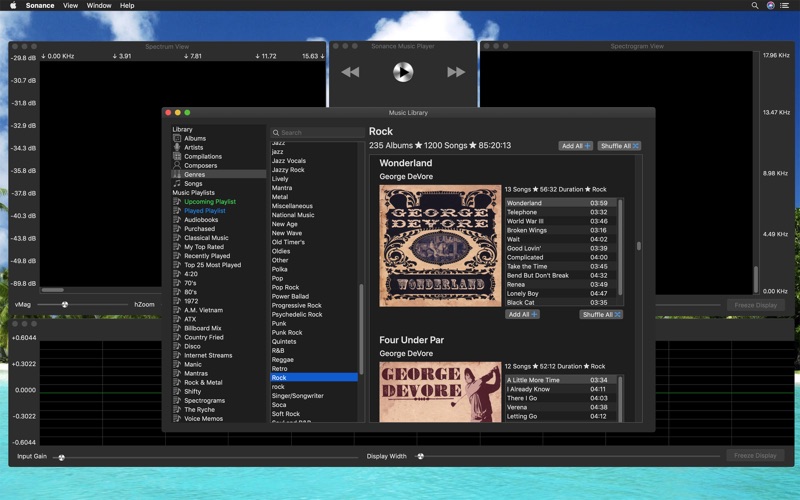
The music player plays songs from the local iTunes library. These songs must be local to the mac where Sonance is installed. Home sharing from another mac is not supported by the iTunes Library Framework at this time. Support for iTunes library assets that are internet streams or internet radio stations is supported in a limited fashion. It will play those selections, however raw audio data is not always available, in that case the displays only work though what the microphone picks up.
The waveform view displays the raw input signal as a continuous wavy line, where each wave is a pulse of sound.
The spectrum view displays the frequency distribution as vertical bars, each bar represents a group of frequencies, the height indicating the strength of those frequencies within the audio signal.
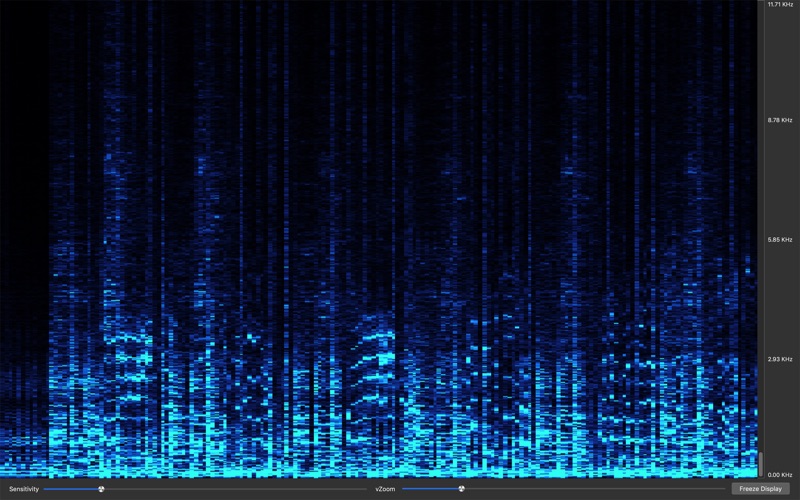
The spectrogram view displays a two dimensional view of audio spectrum frequencies, over time. Each pixel represents a group of frequencies, it's color indicates the strength of those frequencies. The vertical rows represent different frequencies, and the horizontal columns represent time.
Frequencies range from 0 hertz to 48000 Hertz or 48K, this is half the sample rate of 96000 audio samples per second of a macbook pro internal microphone maximum sample rate. The display frequencies are half of the input device sample rate, which can be 44100, 48000, 88200, or 96000 samples per second. For music played via the music player, it depends on the rate contained within each song, most are in a range from 0 to 22050 Hertz, or half the 44100 samples per second used in compac disc recordings.
Since it also uses the microphone, any sound the mic can pick up is analyzed and displayed, so you can play music on your computer, or use a different sound system and see the frequency distribution, spectral density, and waveform.
In the Waveform View, you can adjust the Input Gain ( waveform height ), Display Width on the fly, and freeze the display.
The horizontal scale represents time in seconds. The vertical scale shows the audio sample value. For the 32-bit floating point audio codec, values range from -1.0 to 1.0. Voltage or power units are lost during conversion to the digital format.
Input levels differ greatly between recorded audio, and the microphone. Sonance has independant settings for both modes, and will switch automatically. This affects Input Gain on the waveform view, vMag on the spectrum view, and sensitivity on the spectrograph view.
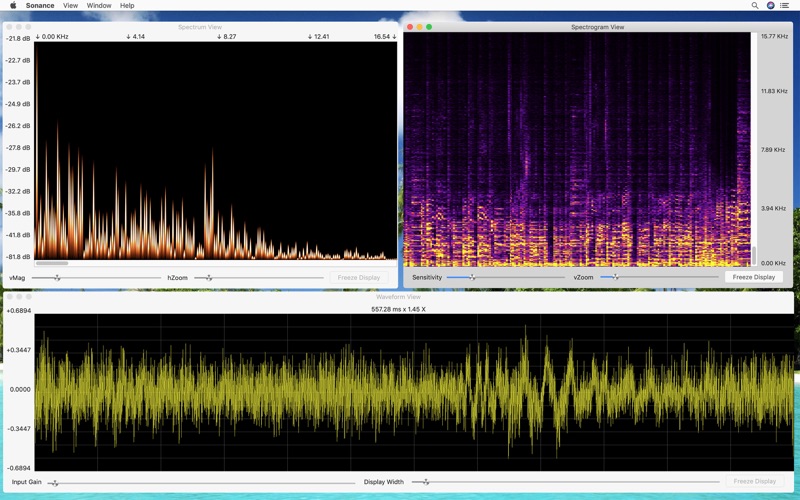
In the Spectrum View, you can adjust the Vertical Magnification ( vMag ) and Horizontal Zoom ( hZoom ) on the fly. The vertical magnification adjusts the bar height, and the horizontal zoom, allows you to zoom in on specific frequencies. After changing the hZoom slider, you can use the scrollbar to see the entire spectrum, albeit zoomed in.
In the Spectrogram View, you can adjust the Sensitivity slider to control the color intensity. The Vertical Zoom ( vZoom ) slider, acts much likes the hZoom slider on the spectrum view. Once you have adjusted your zoom level, you can use the scrollbar to see the entire spectrum, albeit zoomed in. Use the button to freeze and unfreeze the display.
Full screen display is available for each of these three views. Select the View menu item, then Full Screen Display, or you can use the Command-F keystroke. You can also click the full screen display in the View menu. This will put the key or active window into fullscreen display mode.
You can record a spectrogram for later viewing too. By selecting View -> Spectrogram Recording Control Panel, you can start and stop recording and save your data.
